Objectives of this blog is to invoke ideas about getting organized information out of Business Central. Helping you understand the versatility of standard reports, reviewing report building tools for financials, sales, purchases and inventory, building ad-hoc reports, how to edit external facing documents such as invoices and purchase orders, learning how easy Excel layouts are made and saved and, last but not least, seeing the new Analyze feature.
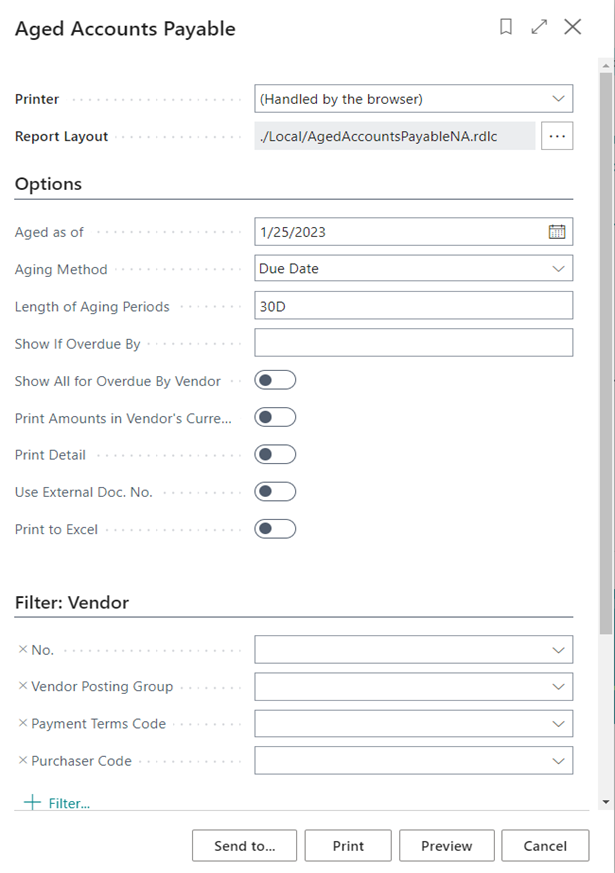
Many standard reports have very powerful options such as print detail or print to Excel. Some like the accounts receivable and accounts payable reports have options for aging buckets, what transaction to include and more. Filtering is a BIG feature for all standard reports.
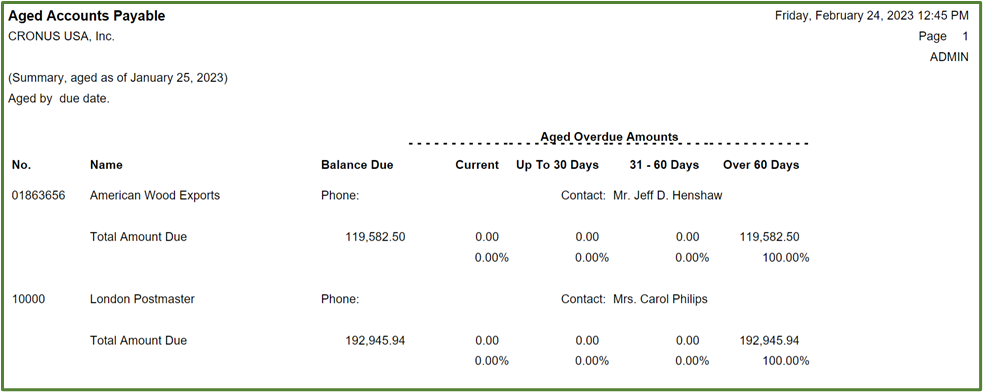
Gives you a Summary report:
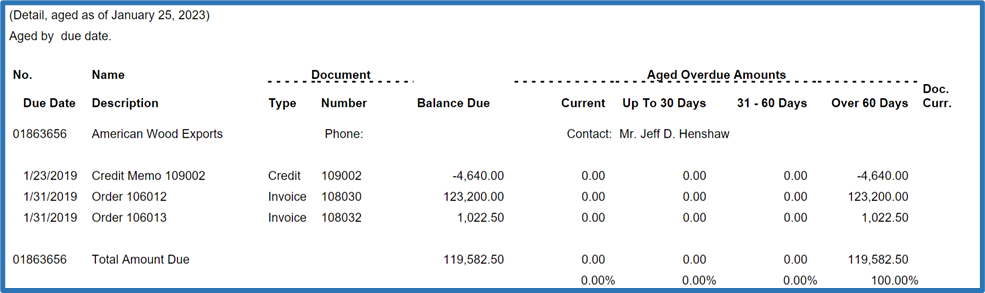
And a Detail report:
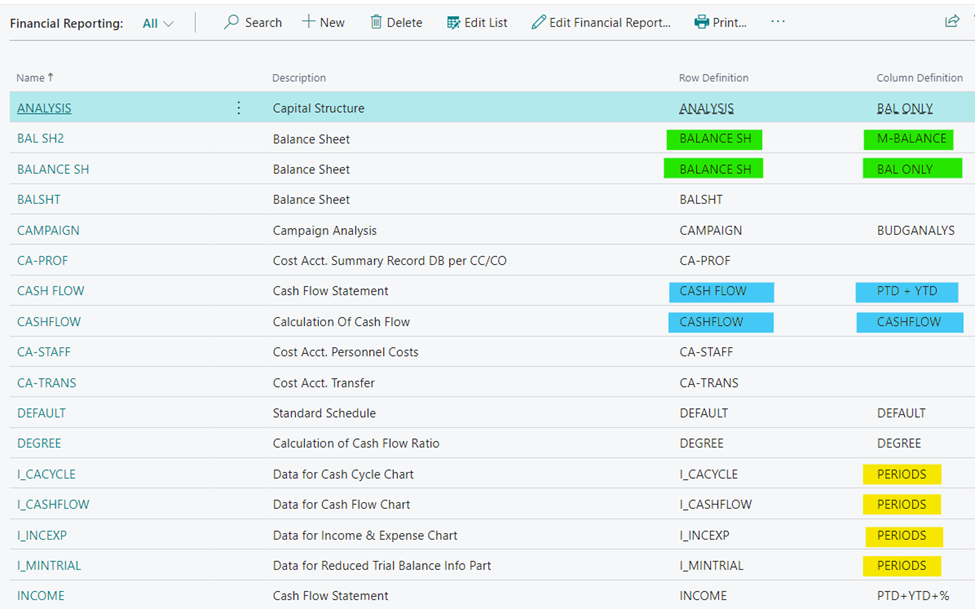
Financial Reports replaced account schedules a couple of versions ago. Allowing you to define row and column combinations of reports. Define the accounts, dimensions and totals on the lines and then define the columns to apply to a single or multiple reports.
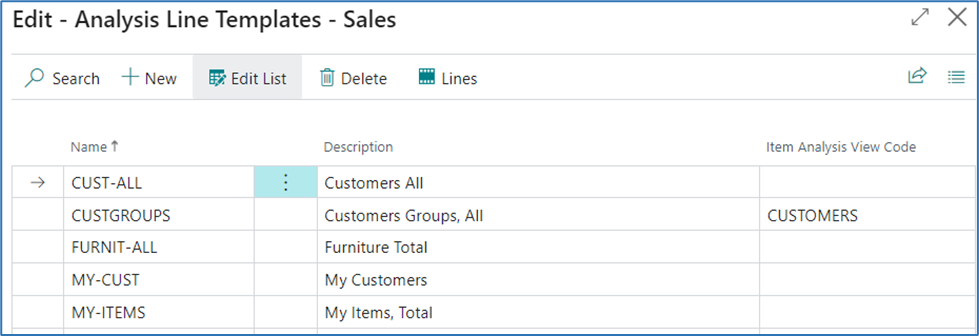
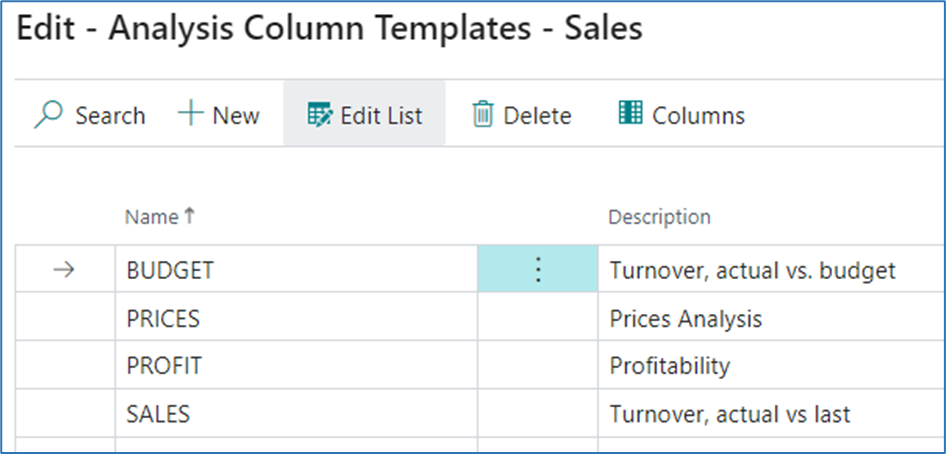
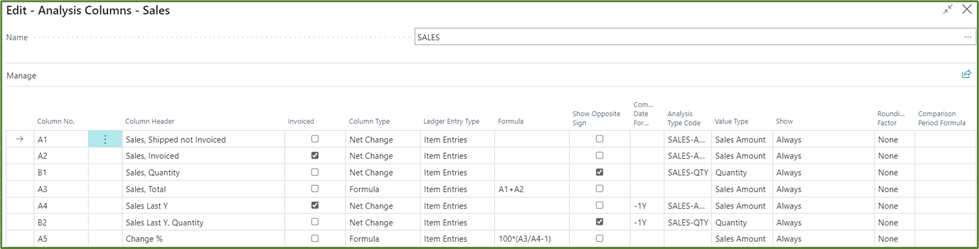
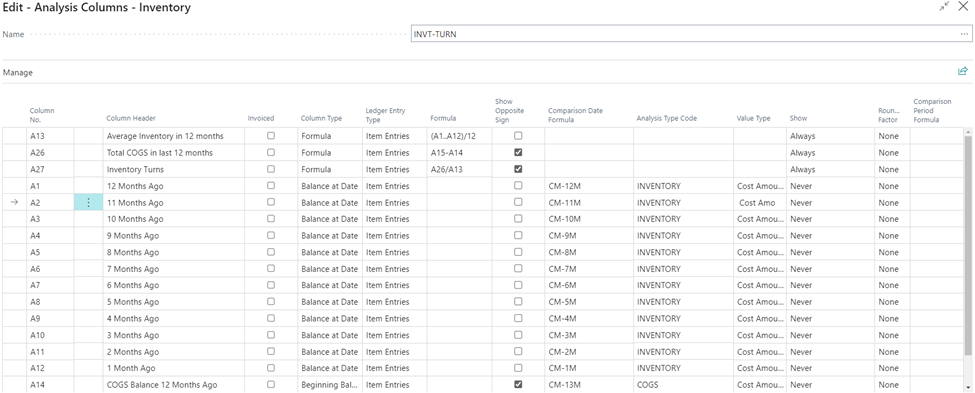
Analysis reports are very similar to financial reports in that you define the data to be included on the rows of the report and in the columns. Sales line setups allow the defining of customers or customer groups, items or item groups, salesperson and use formulas. Columnar information includes various amounts, quantities and formulas. Purchasing and Inventory are the same with purchasing including vendors not customers and inventory having some specific columnar fields.
Sales example:

Inventory example:
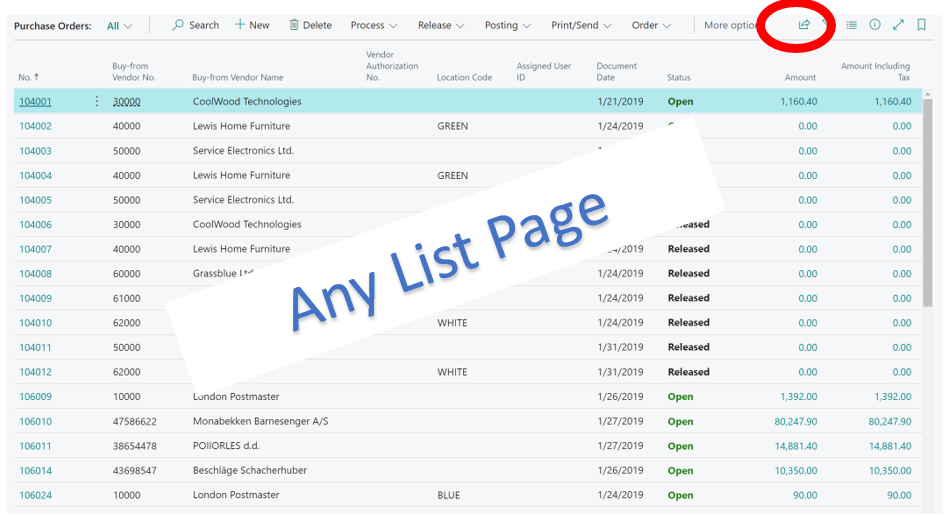
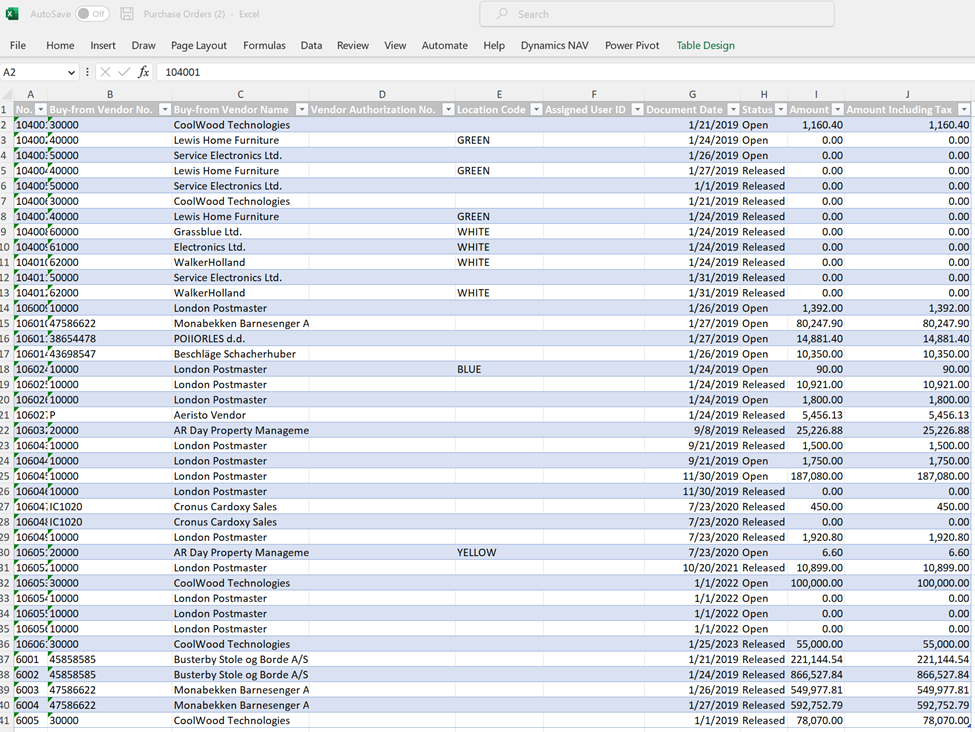
Ah-Hoc reports can be made for any screen showing rows and columns by simply being exported to Excel. Once in Excel the data can be edited, reorganized, deleted, etc.
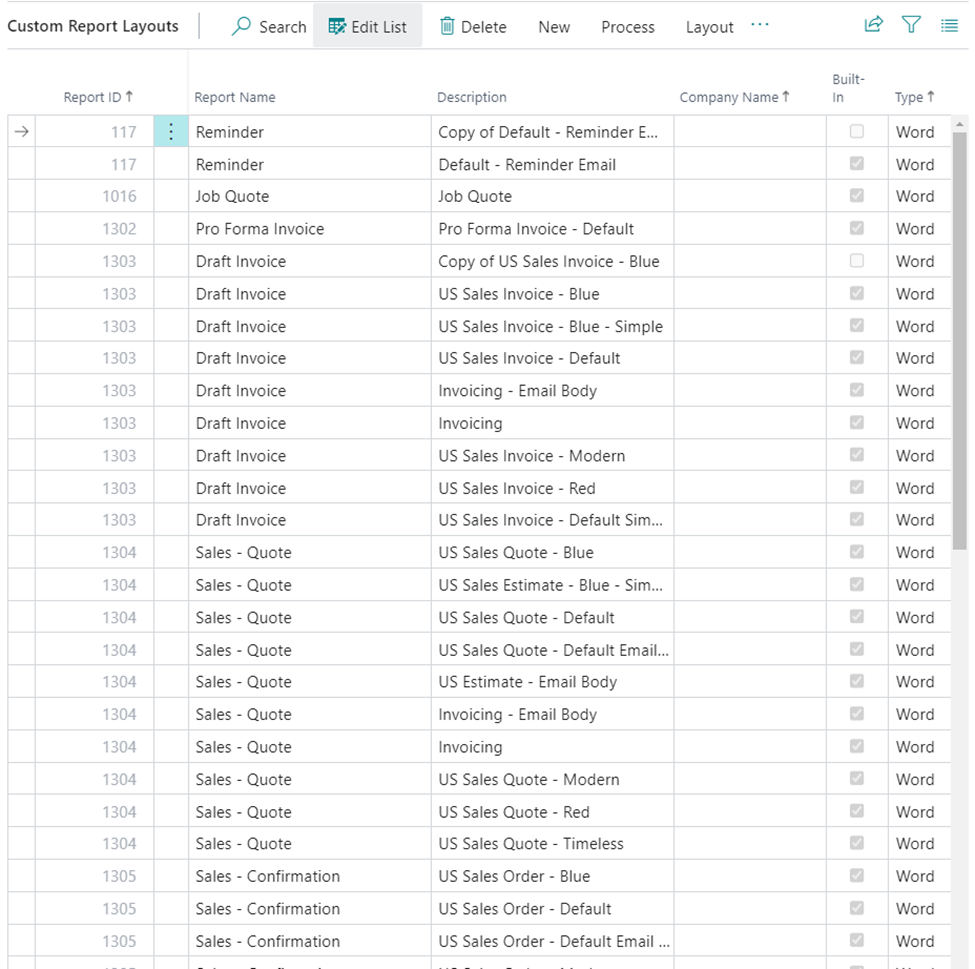
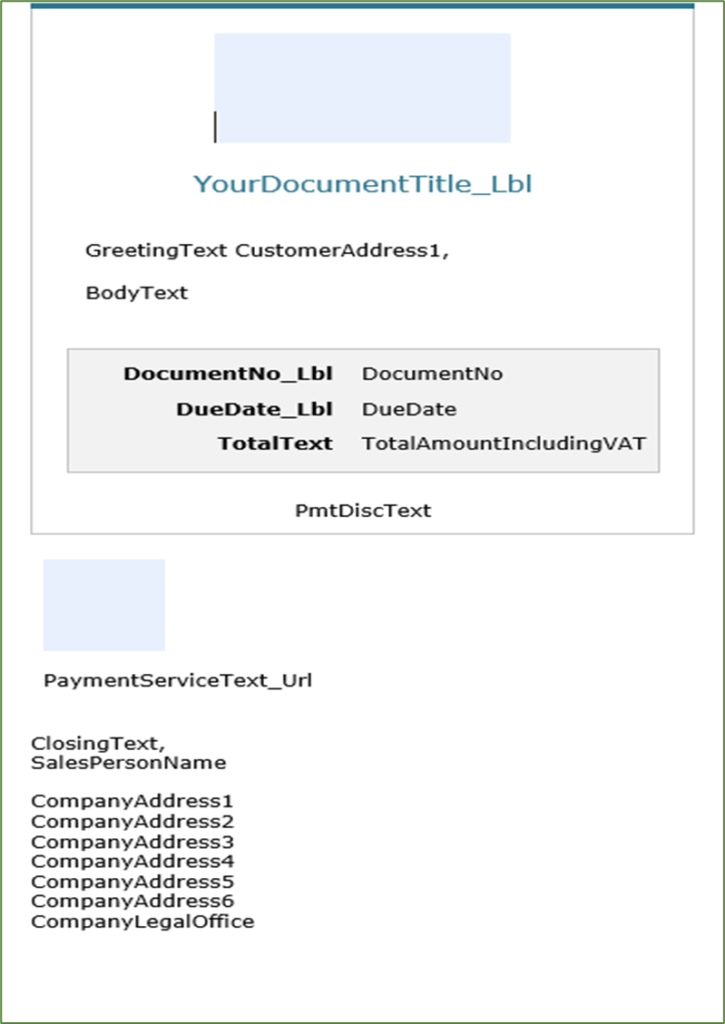
Documents such as sales invoices, purchase orders, computer checks and more can be edited in WORD without needing a developer or programmer. This is a tremendous capability for users to be in control of their external facing documents.
Some of the standard custom reports:
Example of Email format:
Last year Microsoft added Excel Layouts, this is a fabulous tool for creating reports with visual enhancements. Take a report you like from Business Central, add Excel capabilities to analyze and make it more with charts graphs. Now the base report or your custom format at anytime.
The steps to create Excel Layouts are EASY:
- Find the Report to Modify
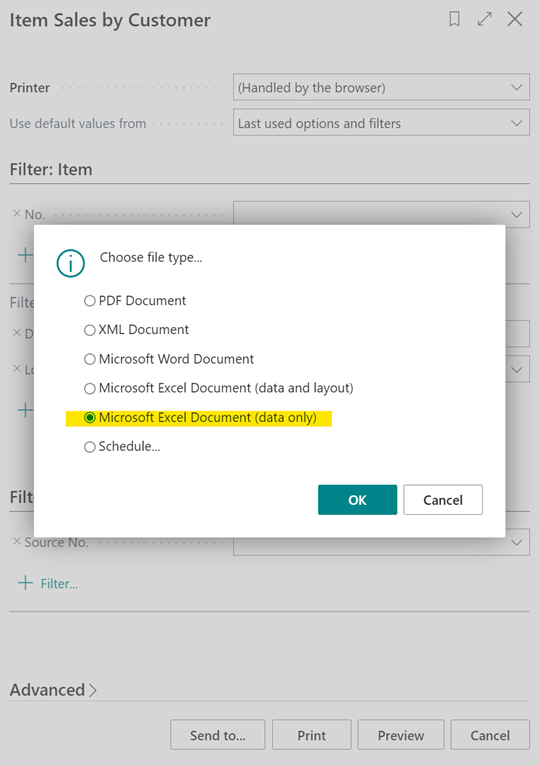
- Run report using Excel and Data Only option
- Delete any columns desired
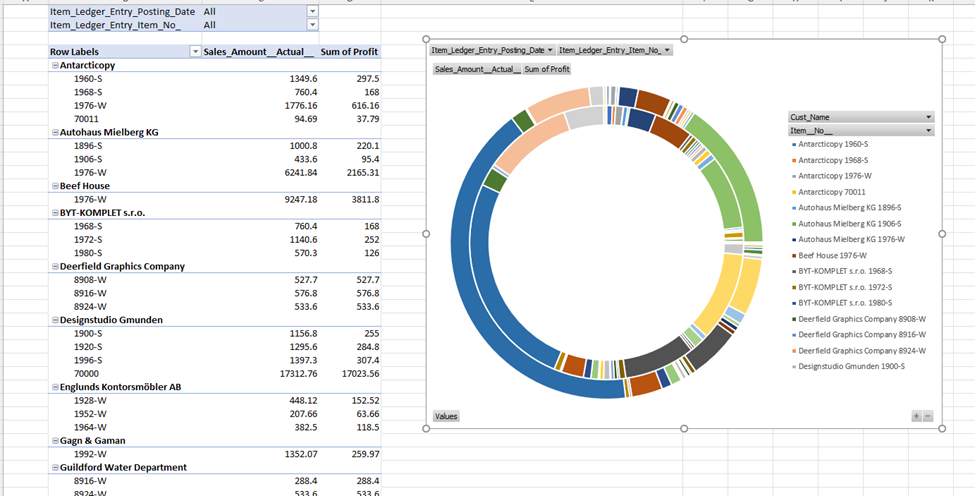
- Add sheets, pivot tables, charts
- Save spreadsheet
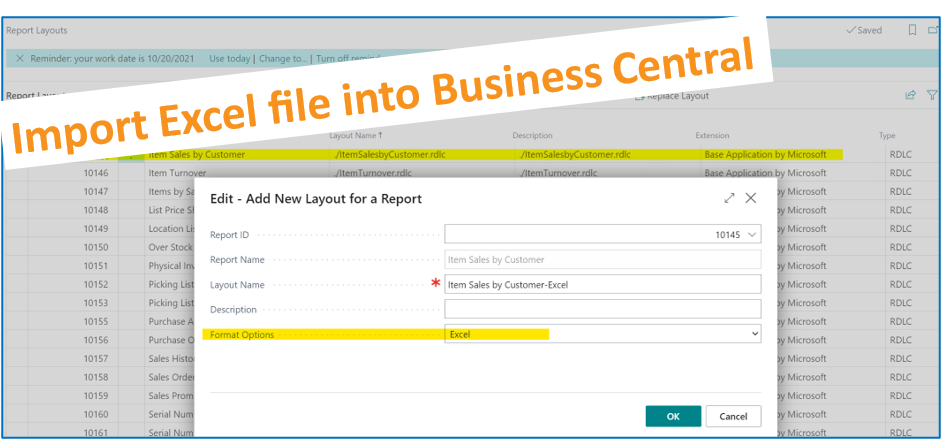
- Create new report layout, import spreadsheet
- Process report and Abracadabra!!
Steps 1 and 2 – Choose Report, Send to Excel
Step 3 – Edit but do not rename the data sheet and do not rename the columns. You can delete columns.
Start:

Finish:

Steps 4 and 5 – Edit, add and save it
Step 6 – Import into BC
Step 7 – Run standard report or your edited report at anytime!!!
New Analyze feature found in BC version 22 further expands the ability to view and review data instead BC without any other tools. You must enable this feature before you can use it prior to the fourth quarter of 2023.
You’ll know you have the feature enabled it you see….

The above option on all list pages.
When you toggle this one, the screen will change and two options will display on the right hand side of the screen.
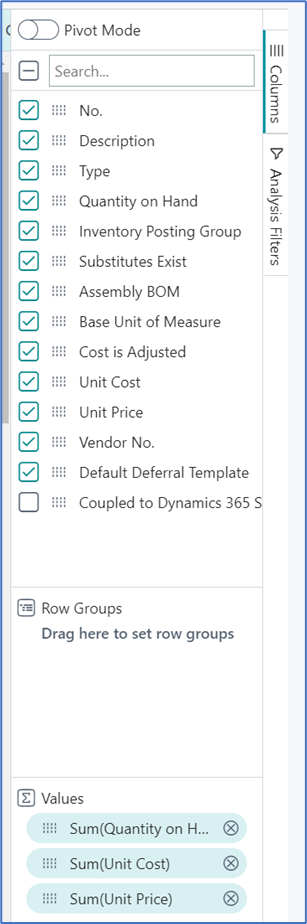
You can remove and add fields, sum various columns and save the Analysis to a name of your choosing. However, you do not have to save, the system automatically saves your settings.
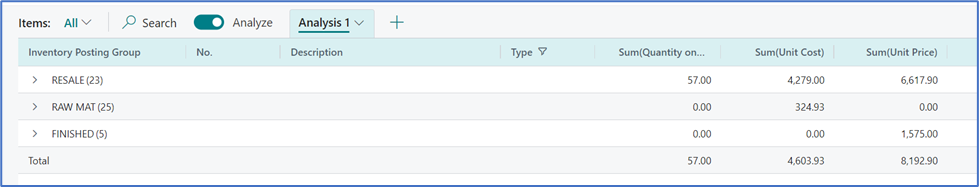
Example of a Pivot table:
Hopefully, this blog sparked ideas of how you can improve your reporting and data analysis from Business Central.