
Posted with permission. Well worth the read to understand what’s been done in reporting and what’s the plan moving forward so that you can be aware and ready. Thanks Kennie!
Principal Program Manager at Microsoft
December 8, 2023
The 2023 release wave 2 of Business Central has been out for a few months, the Business Central Launch event (BCLE) went live with videos for all the new features, and we presented at major conferences for users (UG Summit in the US) and for partners (Directions EMEA in Europe). As a new thing, videos are now also getting published on the new official Business Central Youtube channel https://www.youtube.com/@MicrosoftDynamics365BC/videos
One message that I have worked hard on to get through to Business Central users and partners is the following
The world is changing (in Business Central reporting)
What does that mean? Well, it means that in the product group, we are very serious in changing the experience for Business Central users in the area of data analytics, Business Intelligence (BI), and reporting. Over the last three years, together with my colleague Taylor (the name has been changed to protect the innocent…) we analyzed the customer needs in this space, studied what competitors do in this space, read analyst reports, and interviewed partners. Based on this data, we developed a product strategy with the mission
“Democratize BI, reporting and data analysisfor end-users by making Business Central data available, allowing users to be data-driven with no or little need to pay partners to achieve this.”
We were very much inspired by the way Power BI puts it
Traditionally, a lot of reporting in Business Central has been done using the report object in AL. Early on, we learned that when discussing the concept of reporting, we needed to clarify that while the report object can be used for three different things:
- Analytical reports (such as Chart of Account, Purchase statistics, or Customer – Top 10 list), or
- Processing only reports (AL code with a request page), or
- Printable documents (e.g. invoices)
In all of our presentations, we made it very clear that the strategy was about the first (analytical reports). That also goes for this article.
We then developed the following vision:
“In <insert year here>, all analytics/reporting is designed for online (no print) consumption.”
with three core pillars
- Consume data: Core business scenarios have out-of-the-box reporting/analytics
- Enhance: Most user analytics needs covered with nocode/lowcode solutions
- Enhance: Customers have access to all data – for BI and advanced analytics
Everything in the strategy and in the release plans in the area of reporting maps to these three pillars (apart from tactical investments we also needed to do). You can see how
- In 2022 release wave 1, we introduced Excel layouts (nocode/lowcode report layouts)
- In 2022 release wave 2, we enhanced financial reporting (nocode financial analysis/reporting)
- In 2023 release wave 1, we introduced data analysis on lists (nocode ad-hoc data analysis)
- In 2023 release wave 2, we introduced support embedding for Power BI metrics scorecards (nocode tracking of KPIs)
- In 2023 release wave 2, we enhanced embed Power BI for AL developers (laying the ground for the future)
- In 2023 release wave 2, we introduced data analysis on queries (nocode ad-hoc data analysis)
But wait, Kennie. You talked about that you guys analyzed the customer needs in this space. Where does that fit into the story?
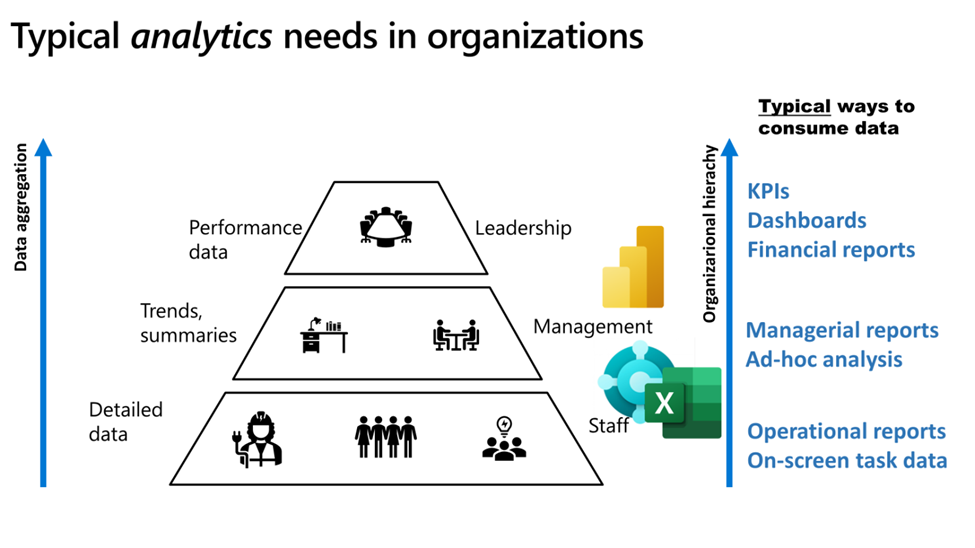
Good question and nice to see that you are awake. To guide us, we used the following mental model when thinking of personas and their different analytics needs:
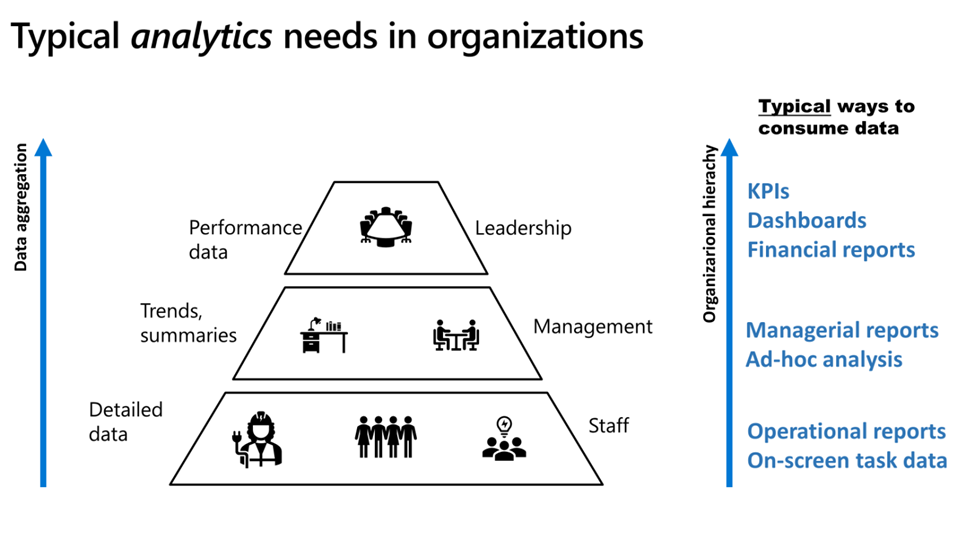
The model is based on the observation that different roles in an organization has different needs when it comes to data: the higher the role is placed in the org chart, the more data needs to be aggregated for them to do their work. To the right, we then mapped typical analytical artifacts/features that we would need to provide to support these user roles.
We used this model to challenge every feature (capability) and every type of report so that we did not let technology drive reporting, but the other way around (this was really challenging for a platform PM like me. But Taylor made a fantastic job keeping me honest to the model.) The result of this was that we were able to map the technologies Power BI, Excel layouts, and in-client data analysis like this:
So far, so good. In the list of features above, starting in 2022 release wave 1, you can now see that most building blocks to deliver on the vision is now in place. And this takes me back to the title of this article: The world is changing (in Business Central reporting). Because what is needed now, is a shift in mindset of Business Central developers, consultants (and users): Where in the past, most of the needs above would be solved by building a report (likely with an RDL layout) designed for printing to paper or to a PDF document, now we expect that users want to design (and consume) analytics online. Using Power BI, Excel layouts, and in-client data analysis.
This is why we pushed so hard on reporting and data analysis sessions at the Autumn conferences. This is why we had BCLE sessions on analytics both for users and for developers. And both sessions are available on Youtube for you to watch (now with a background knowledge that I hope will bring more clarity to the content.).
So if a customer asks, “Can you build me a report?”
STOP asking “Sure. How should it be formatted?”
INSTEAD ask “What do you need to analyze and for what?”
THEN choose the tool of choice
- Power BI (and embed), or
- Query/List page with Data Analysis, or
- AL report with Excel layout
Check out the two videos (they have chapters for easy consumption and navigation) to learn more:
Introducing: Analyze data on lists and queries (2023 release wave 2) – YouTube
In this video, we show you the new capabilities, which we added to the Analyze Data feature on list pages, namely UX changes for easier usage, the ability for users to share analysis tab definitions, and how an administrator can turn off the feature with a new permission. We will then show how the same features now also work on top of query objects and discuss how this sometimes can be used as a replacement reports.
What’s new: Power BI and reporting for developers (2023 release wave 2) – YouTube
In this video, you will learn about the new capabilities you as a developer get in the reporting stack to support analytics scenarios for users. First, we will show the new Power BI embed capabilities in AL that allows you to control which Power BI content is available where. Second, we will show you how you can use a new UI on queries, allowing users to slice and dice the data directly in the client. We will also show how you can attach queries to pages and role centers. We also have some important news to share in Excel layouts. Finally, we will demo how you can incorporate teaching tips and help links on queries and reports.
I hope that after reading this article and (re)watching the videos on Youtube, you agree with me that… The world is changing (in Business Central reporting).
Are we done yet? No. Stay tuned and follow the work of analytics in upcoming releases of Business Central. And see if new features in this space might just map to the mission, the vision, and the requirement model (the triangle). I hope they do.
Again Thanks to Kennie for this great explanation!