
Hiding in Plain Sight, Article 1 of 7 | By Kim Dallefeld, Microsoft MVP
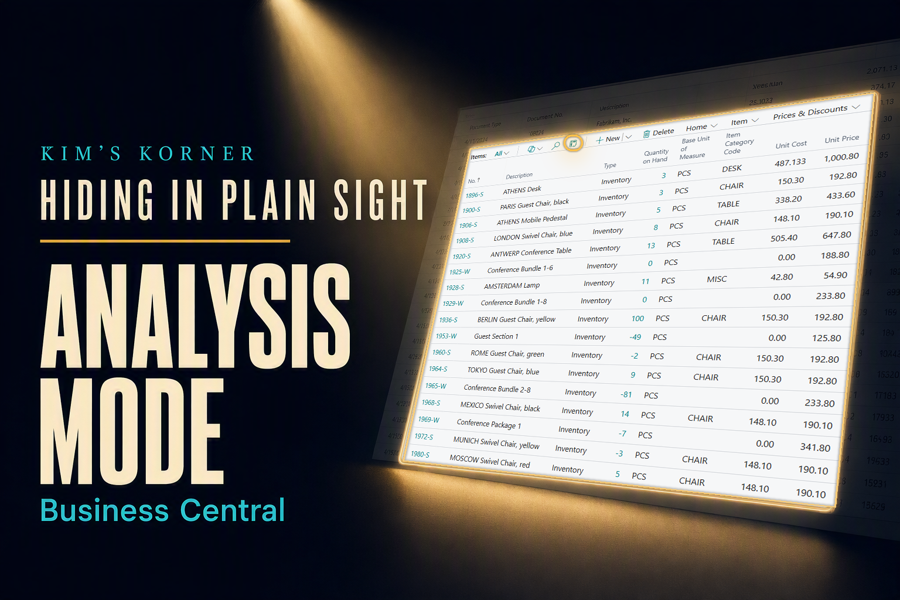
A manager stops by your desk with a question. How much did we buy from each vendor last quarter? Which customers are carrying the largest balances? What did each salesperson actually close?
If you have worked in Business Central for any length of time, you know the reflex that follows. Open the list page, export to Excel, build a PivotTable, format the result, answer the question. Then do it again next month, because the spreadsheet on your desktop went stale the moment you saved it.
I love Excel. I have built more workbooks than I can count. But somewhere along the way a lot of us stopped noticing that Business Central grew its own way to answer these questions, and it has been sitting one click away the whole time.
What Analysis Mode actually is
Analysis Mode is a way to summarize and explore data directly on a Business Central list page. You stay in the application, you work with live records, and you build the view yourself without writing a report or opening a spreadsheet.
If you know your way around a PivotTable, you already know how to think about it. You choose what goes down the rows, what goes across the columns, and what gets totaled in the middle. The vocabulary is familiar; only the location has changed.
Within a list page you can:
- Group records by any column, such as vendor, customer, item, or posting date
- Summarize amounts and quantities with subtotals and grand totals
- Filter down to the period, dimension, or population you care about
- Pivot the layout to compare periods or categories side by side
- Rearrange, add, and remove columns as your question changes
- Save the arrangement as a tab you can return to later
A question I get asked constantly
Here is the scenario I use in almost every training session, because every finance team recognizes it. The CFO wants purchasing volume by vendor for the last six months, and wants it before the meeting starts.
The old path is an export, a PivotTable, a round of formatting, and a spreadsheet that is obsolete by the time anyone opens it. The new path takes about a minute:
- Open the ledger entry list for the entries you want to examine.
- Switch the page into Analysis Mode.
- Drag the vendor field into rows and the amount field into values.
- Filter the posting date to the last six months.
- Read the answer off the screen.
No export, no formula errors, no version of the truth living in someone’s Downloads folder. And when the CFO asks the inevitable follow-up question, you drag one more field and answer that too, while you are still standing there.
Why this one has become a favorite
Answers arrive in minutes rather than weeks. A surprising share of the report requests that land in a consultant’s queue are really one-time questions wearing a report’s clothing. When a user can answer those questions without help, the development backlog gets shorter and the genuinely custom work moves faster.
The numbers are live. You are looking at the records themselves, not a snapshot someone exported on Tuesday. That matters most during a close, when the underlying data is still moving and a spreadsheet from yesterday morning quietly misleads everyone reading it.
The skill barrier is low. There is no report designer to learn, no Power BI model to build, no DAX to write. If a user can filter a list and understands what a subtotal means, they can build something useful in an afternoon.
Good work gets reused. Once an arrangement earns its keep, save it and return to it next month rather than rebuilding it. This is where teams see the real time savings, and it is also the part most users never discover on their own.
Where I use it most
General ledger entries are my first stop, usually grouped by account and dimension to answer the question that would otherwise turn into a financial report request. Customer ledger entries come next, grouped by customer to see who is carrying a balance and how long they have been carrying it.
Vendor ledger entries answer the spend questions that arrive at budget time. Item ledger entries are useful for movement and valuation questions, particularly when someone is trying to work out why a cost looks wrong. Sales and purchase documents round it out for pipeline and commitment reviews.
The pattern is simple enough to state as a rule: if you are looking at a list page and wondering how to summarize what is on it, Analysis Mode is probably the answer.
Kim’s Quick Tip
Before you request a custom report, ask yourself one question: can Analysis Mode answer this? You may be surprised how often the answer is yes, and how much faster you get to the number.
Final thoughts
Analysis Mode is not the feature that gets the keynote slide. It does not have the shine of Copilot or an AI agent, and nobody is going to write a press release about grouping ledger entries by vendor.
What it does is quieter and, I would argue, more valuable. It shortens the distance between a business question and its answer, it keeps people working with live data instead of stale copies, and it hands users a measure of independence they did not know they had.
That is the theme of this series. The features worth knowing are rarely the newest ones. They are the ones already sitting in your system, waiting for someone to notice them.
What is your favorite Business Central feature that most users walk right past?
#BusinessCentral #MSDyn365BC #Dynamics365 #Accounting #ERP #MicrosoftMVP